Tweets in Worldwide

🚨 TSLA Short Position Entry with Ichimoku & ATAMOKU - January 2,2025 (No.1)
🔎 Today, I analyzed Tesla, Inc. (TSLA) using monthly, weekly, daily, and 1-hour charts with the Ichimoku Cloud and ATAMOKU indicator. Based on this analysis, I am entering a short position to test the effectiveness of these indicators in decision-making.
Analysis Overview:
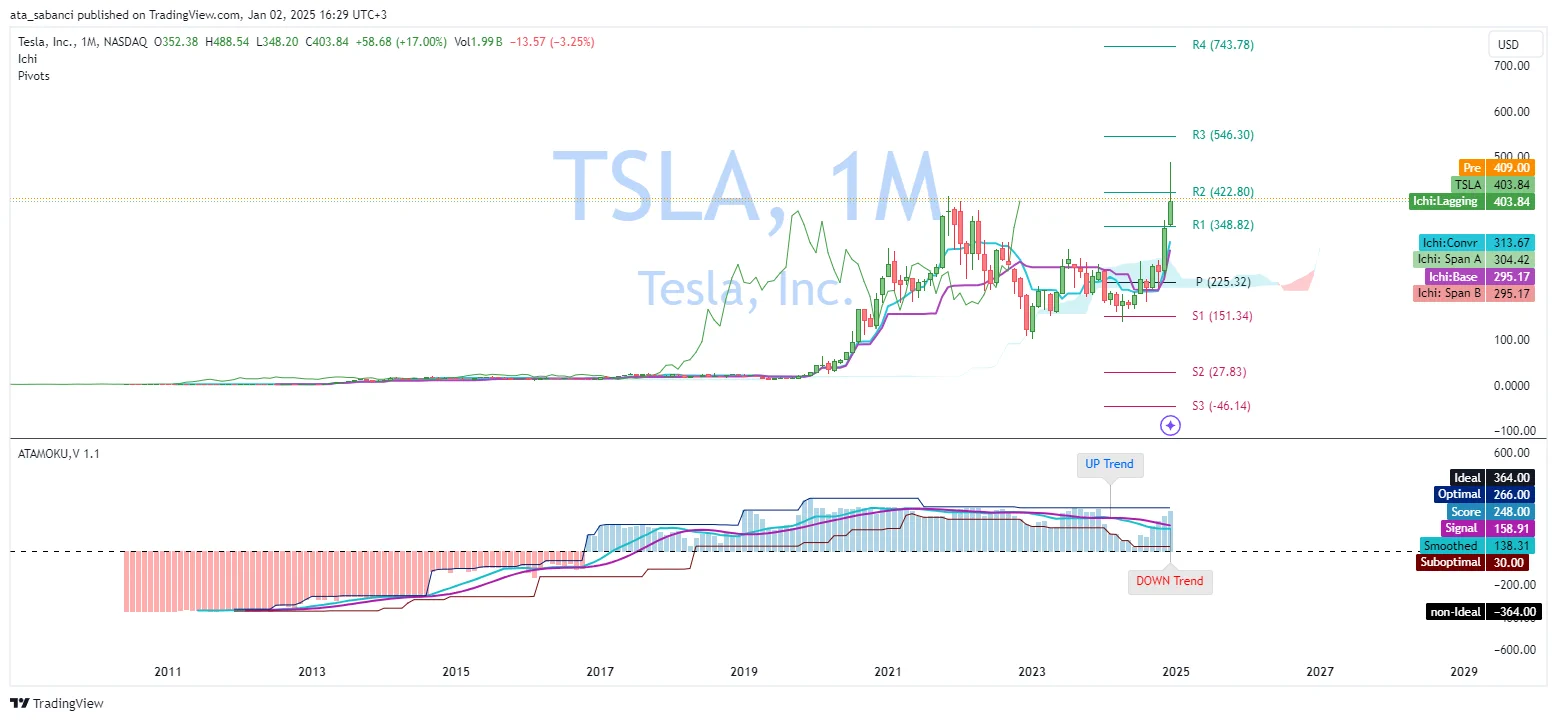
🟢 Monthly Chart:
TSLA is trading above the Ichimoku Cloud, confirming a long-term bullish trend. The ATAMOKU score is positive (248), and resistance lies at R2 ($422.80).
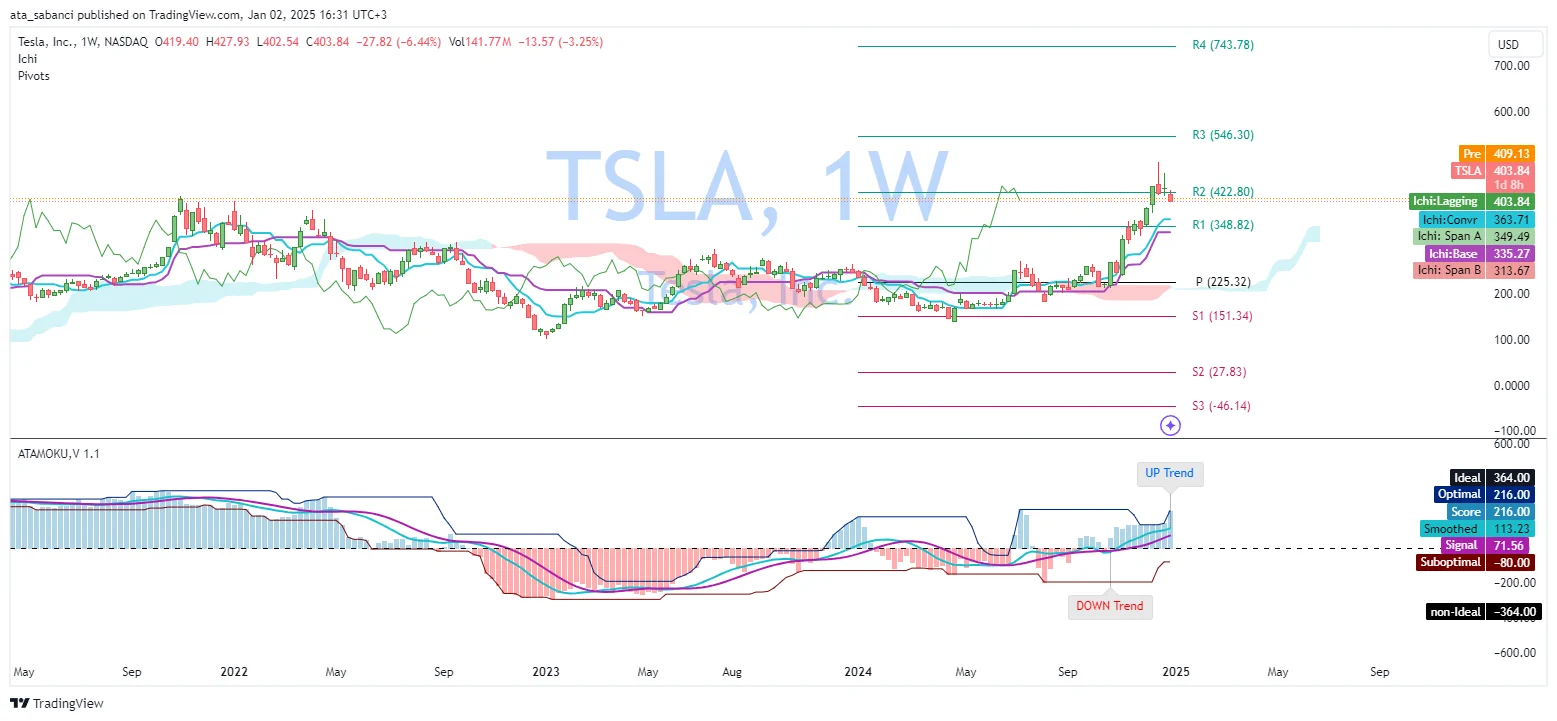
🟡 Weekly Chart:
The broader trend remains bullish, but TSLA shows signs of consolidation below R2 ($422.80). Key support is at the Base Line (Kijun-sen, $335.27).
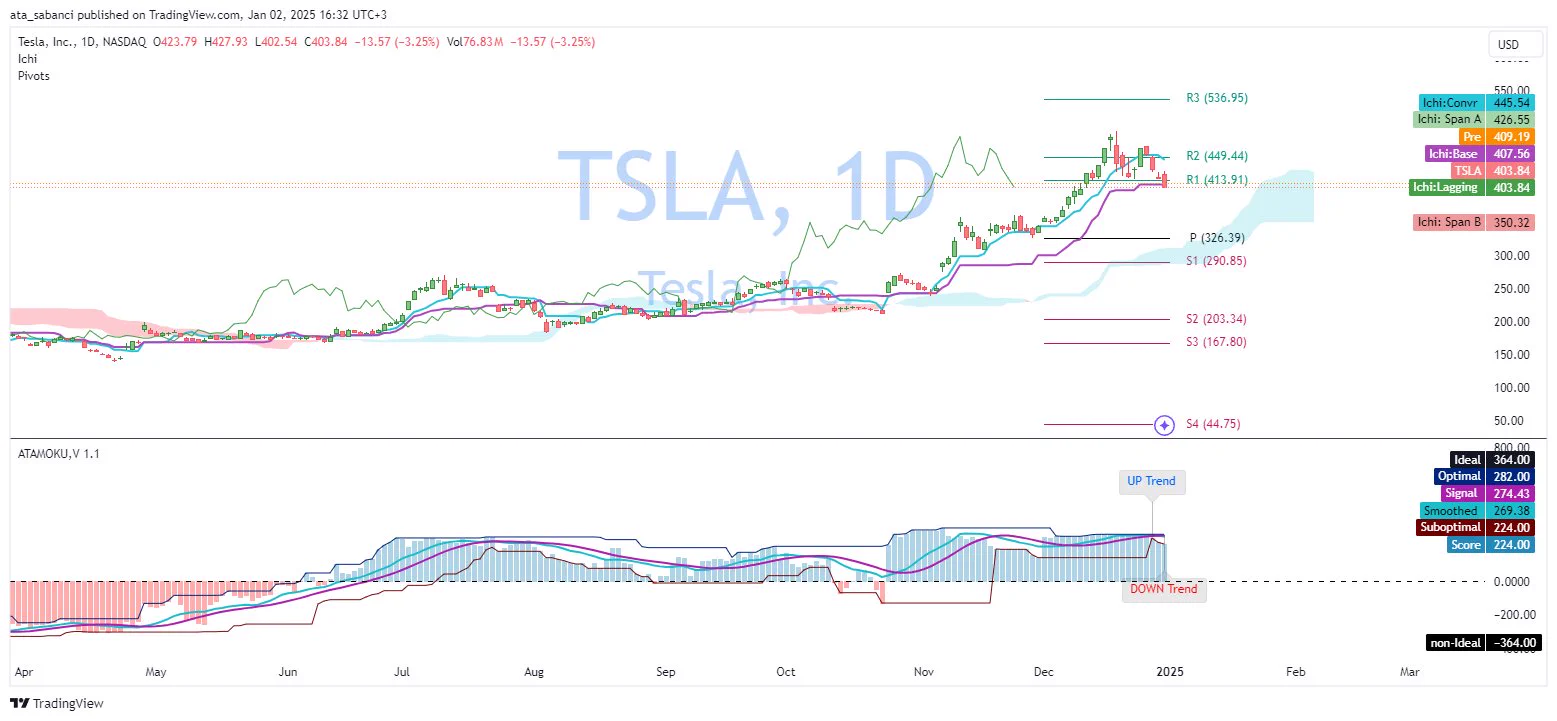
🔴 Daily Chart:
The price is nearing the Conversion Line ($445.54) but remains supported by the Ichimoku Cloud, suggesting caution in the medium term.
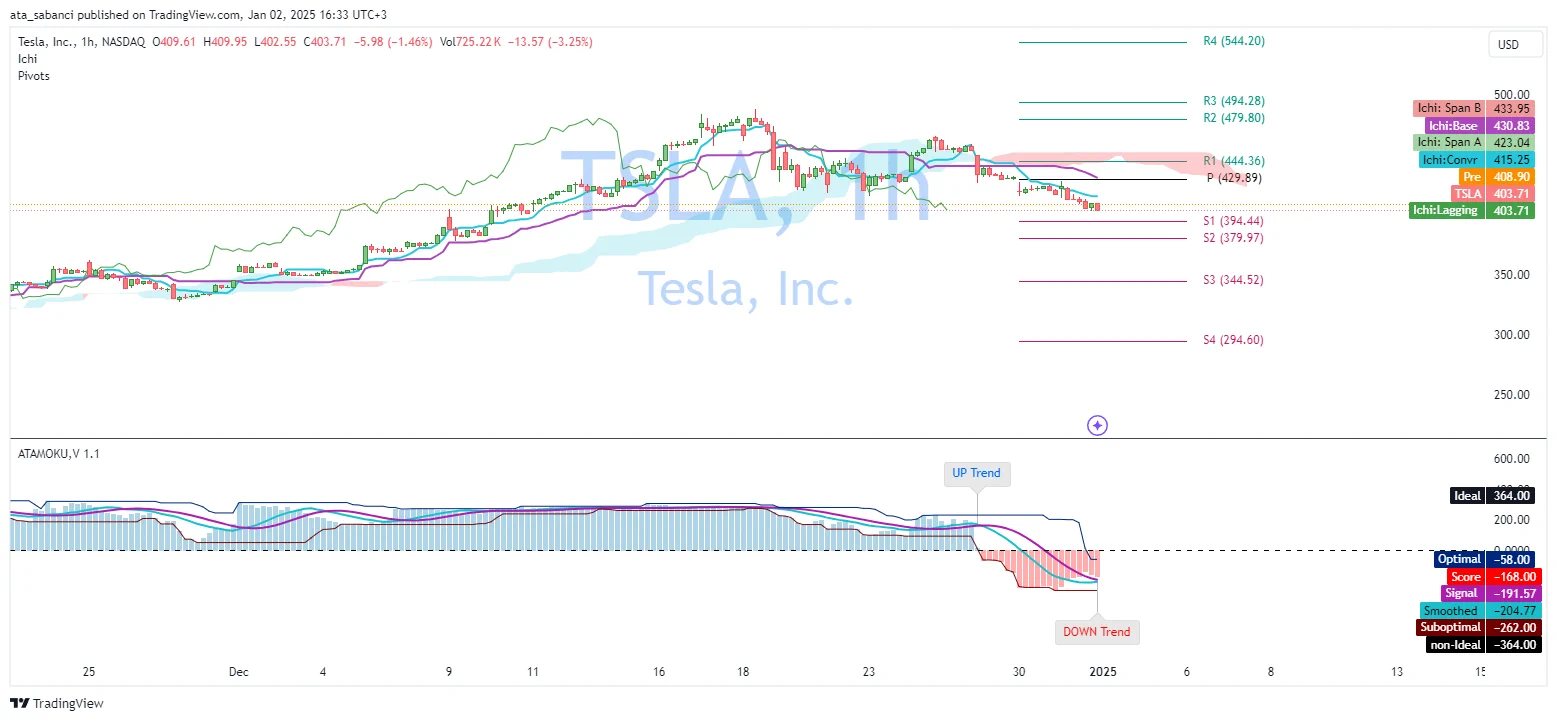
⚠️ 1-Hour Chart:
Short-term bearish momentum dominates, with TSLA trading below the cloud. R1 ($444.36) acts as a key resistance level, while support lies at S1 ($394.44).
Trade Execution:
📌 Action: Opened a short position of 5 shares at $444.36, targeting the short-term resistance on the 1-hour chart.
This position aligns with the short-term bearish trend while respecting the broader market context.
-------------------------------------------------------------
💡 Disclaimer:
This is an educational post. I’m using paper trading to demonstrate how traders apply indicators like Ichimoku and ATAMOKU in their decision-making process.
For a deeper understanding of my journey, approach, and methodology, check out my earlier post as following:
Always conduct your own research and analysis before trading. 📚
#StockMarket# #TSLA# #TeslaStock# #StockAnalysis# #IchimokuCloud# #ATAMOKU# #ShortPosition# #TechnicalAnalysis# #PriceAction# #TradingStrategy# #ChartAnalysis# #VolumeAndPrice# #StockTrader# #MarketTrends# #RiskManagement# #BearishMomentum# #TradingEducation# #NASDAQ# #InvestmentStrategy# #TrendAnalysis# #TransparencyInTrading# #PivotPoints# #FinancialMarkets# #DynamicSupport# #ResistanceLevel# #MarketBehavior# #LiveTrading# #StockCharts# #TechnicalIndicators# #TradingViewIdeas# #StockMarketEducation#
Show more
0