Tweets in Worldwide

แด่นักลงทุน... ผู้ไม่กลัวความสูง รวมมาให้กองทุนสาย Bitcoin 🚀 ในจังหวะที่ราคา To the Moon ลุ้น ✨ 100,000 เหรียญ
ปัจจุบันเราสามารถลงทุน Bitcoin ผ่านกองทุนรวมของไทยได้แล้ว ทั้งการลงทุนโดยตรงผ่าน Bitcoin ETF รวมถึงการลงทุนทางอ้อมผ่านธุรกิจที่เกี่ยวข้องและมีรายได้จาก Bitcoin, Digital Assets อื่น ๆ และ Blockchain จึงสรุปมาให้ดังนี้
กลุ่มแรก 🔥 กองทุนไทยที่ลงทุนตรงใน Bitcoin ETF
1️⃣ MBTCETF-UI
กองทุนที่ลงทุนในหน่วยลงทุนของ iShares Bitcoin Trust (กองทุนหลัก) ในสกุลเงินดอลลาร์สหรัฐ โดยเฉลี่ยไม่น้อยกว่า 80% ของ NAV ซึ่งเน้นลงทุนโดยตรงใน Bitcoin
2️⃣ ONE-BTCETFOF-UI
กองทุนที่ลงทุนใน Bitcoin ETF ตั้งแต่ 2 กองทุนขึ้นไป โดยเฉลี่ยไม่น้อยกว่า 80% ของ NAV ได้แก่ iShares Bitcoin Trust และ Fidelity Wise Origin Bitcoin Fund
(หมายเหตุ: MBTCETF-U และ ONE-BTCETFOF-UI เป็นกองทุนที่ห้ามขายผู้ลงทุนรายย่อย | กองทุนรวมที่เสนอขายผู้ลงทุนสถานบันและผู้ลงทุนรายใหญ่พิเศษ | กองทุนรวมที่มีความเสี่ยงสูงหรือซับซ้อน)
...
กลุ่มที่ 2 ✨ กองทุนที่ลงทุนในธุรกิจที่เกี่ยวข้องกับสินทรัพย์ดิจิทัลและบล็อกเชน
1️⃣ ASP-DIGIBLOC
ลงทุนผ่านกองทุนหลัก VanEck Digital Transformation ETF ที่สัดส่วนประมาณ 47% ซึ่งเน้นลงทุนในบริษัทที่เกี่ยวข้องกับบล็อกเชน และได้รับประโยชน์จากการเติบโตของสินทรัพย์ดิจิทัล ส่วนที่เหลือจะเลือกลงทุนหุ้นรายตัวเข้ามาเสริมในพอร์ต เช่น Nvidia, MicroStrategy, MARA Marathon Digital
2️⃣ SCBBLOC(A)
เป็นกองทุนที่มีนโยบายบริหารแบบ Passive ผ่านกองทุนหลัก Invesco CoinShares Global Blockchain UCITS ETF ซึ่งจะกระจายการลงทุนในหุ้นที่เกี่ยวข้องกับบล็อกเชน และอุตสาหกรรมคริปโตฯ
3️⃣ KT-BLOCKCHAIN-A
ลงทุนใน ETF ที่เกี่ยวข้องกับบล็อกเชนและสินทรัพย์ดิจิทัล ได้แก่ Amplify Transformational Data Sharing ETF และ The Siren Nasdaq NexGen Economy ETF
Show more

0
อยากเล่าให้ฟัง... ✨ กลยุทธ์ใหม่ของ Finnomena ซึ่งเป็น Private Call ลับเฉพาะนักลงทุนของเราเท่านั้น!🎯 ด้วยโมเดล Robotic Investment (ROBIN) กำหนดจุดซื้อ-จุดขายเป็นระบบ ✅ ผ่านการทำ Live Test ที่ Win Rate สูงถึง 88%
จะว่าเป็นของขวัญปีใหม่ให้แก่นักลงทุนก็ได้ กับการเปิดตัว Private Call กลยุทธ์การลงทุนใหม่ด้วยระบ Robotic Investment (ROBIN) สำหรับผู้ลงทุน Private Wealth & Ultra ของ Finnomena
✨ ความน่าสนใจของระบบ ROBIN คือ เป็นระบบแจ้งสัญญาณการลงทุนโดยใช้การวิเคราะห์ปัจจัยทางเทคนิคกำหนดจุดซื้อและจุดขาย เพื่อสร้างกลยุทธ์การลงทุนอย่างเป็นระบบ (Systematic) ช่วยลดอคติที่เกิดจากการตัดสินใจของมนุษย์
🔥 สินทรัพย์เป้าหมายของการทำระบบแจ้งเตือนสัญญาณ จะอยู่ในรูปแบบของดัชนีหรือกองทุน ETF ที่มีกองทุนรวมในไทยนำเงินไปลงทุนหรือมีความเคลื่อนไหว (Correlation) ใกล้เคียงกัน เช่น ดัชนี S&P 500, NASDAQ 100, Russell 2000, และ SPDR Select Sector Fund – Financial (XLF) เป็นต้น
ทุกกลยุทธ์ได้ผ่านการทดสอบย้อนหลัง (Backtesting) 10 ปี และมีการทำ Forward Test (Live) ผ่านการทดสอบนัยสำคัญทางสถิติ
ผลตอบแทนคิดแบบหลักหักค่าธรรมเนียมในการซื้อขาย (net of fee) ในการทำ Backtesting
✅ เหมาะกับนักลงทุนที่มุ่งหวังผลตอบแทนระยะสั้นถึงกลาง (1-3 เดือน)
ROBIN ใช้ตัวชี้วัดหลัก 2 ตัว
1️⃣ Win Rate ยิ่งสูงเท่าไหร่ หมายความว่ายิ่งมีโอกาสได้กำไรมากขึ้น
2️⃣ Profit Factor หากมากกว่า 1 แสดงว่าได้กำไรมากกว่าขาดทุน ยิ่งค่านี้สูงก็ยิ่งดี
ตัวอย่างกลยุทธ์ของ ROBIN และสถิติ Win Rate - Profit Factor จากการทำ Backtest 10 ปี
✨ กลยุทธ์ Market Breadth กับดัชนี S&P 500
ใช้หลักการจับจังหวะเข้าซื้อในตลาดที่มีแนวโน้มขาขึ้นระยะยาว ถึงแม้ว่าในระยะสั้นภาพรวมหุ้นในตะกร้าดัชนีแสดงแนวโน้มขาลง
- Win Rate 76%
- Profit Factor 2.6
✨ กลยุทธ์ CABB กับ iShares Global Clean Energy UCITS ETF (INRG)
การเข้าซื้อ/ขายออกด้วย Bollinger Band สามารถทำได้ทั้งในลักษณะ Contrarian (ซื้อเมื่อราคาแตะขอบล่าง ขายเมื่อราคาแตะขอบบน) หรือ Trend Following (ซื้อเมื่อราคาแตะขอบบน ขายเมื่อราคาแตะขอบล่าง)
- Win Rate 65%
- Profit Factor 3.2
✨ กลยุทธ์ WVF Reversion กับ Invesco Leisure and Entertainment ETF (PEJ)
มองหาจุดกลับตัวของราคา โดยสังเกตเมื่อ WVF มีค่าเพิ่มสูงขึ้น เพราะอาจเป็นสัญญาณว่าราคาสินทรัพย์นั้น ๆ ลดลงจนถึงระดับต่ำและอาจจะกลับขึ้นไปอีกครั้ง ซึ่งเป็นโอกาสในการซื้อในราคาต่ำ
- Win Rate 77%
- Profit Factor 3.5
🔥 สถิติจากการ Forward Test
โดยเริ่มตั้งแต่ปี 2024 เกิดสัญญาณซื้่อทั้งหมด 9 ครั้ง สามารถสร้างผลกำไรได้ 8 ครั้ง คิดเป็นอัตรา Win Rate ที่ 88.89% Profit Factor 17.53
*กำไรสุทธิจาก Forward Test คำนวณโดยใช้สมมติฐานค่าธรรมเนียมขาเข้าที่ 1.5% โดยบวกรวมเข้าไปในราคาซื้อ (Price In) ของดัชนีหรือกองทุนนั้น ๆ
*ตารางผล Forward Test แสดงเฉพาะเทรดที่ขายออกและรับรู้ผลกำไร/ขาดทุนแล้วเท่านั้น
✅ ล่าสุดเมื่อวันที่ 11 ธันวาคม 2024 ได้เกิดสัญญาณแรกแล้ว เป็น “จังหวะเข้าซื้อ” SPDR Finance
สามารถติดตามคำแนะนำแบบเต็ม ๆ ได้ที่ Opportunity Hub ของ Finnomena
👉
Show more


0

📈 Introducing Divergence-Weighted Clouds (DW) 1.0
🚀 Revolutionize your trading with an indicator that simplifies analysis by exclusively using price and volume data! The DW 1.0 Indicator integrates Divergence-Weighted Clouds, combining multiple metrics into a single, streamlined tool for enhanced clarity and actionable insights.
_________________________________________
✅ Key Features:
📊 Unified Input Data: DW relies solely on price and volume, delivering unmatched compatibility and ease of use.
🔄 ALMA-Based Trends: Advanced Adaptive Linear Moving Average calculations to identify market trends.
🔍 Divergence Detection: Highlight key divergences to spot market momentum shifts.
🎯 Multi-Metric Integration: Combines ADX, Aroon, and Chaikin Money Flow into divergence clouds—all derived from price and volume data.
⚙️ Customizable Settings: Tailor the indicator to fit your unique trading strategy effortlessly.
_________________________________________
💡 Why use it?
DW offers a clean and efficient approach to technical analysis. By focusing exclusively on price and volume, it simplifies the process while delivering actionable insights, helping you detect trend continuations, reversals, or consolidations with confidence.
🌐 Try it out now:
🔁 Let’s collaborate and provide feedback. Together, we can refine this tool and elevate our trading game! 🚀
_________________________________________
⚠️ Disclaimer: DW 1.0 is a powerful guidance tool but should be part of a broader trading strategy. Always practice responsible trading and incorporate risk management.
#DivergenceWeightedClouds# #TechnicalAnalysis# #PriceVolumeAnalysis# #StockMarket# #TradingIndicators# #IchimokuClouds# #MarketTrends# #ADX# #Aroon# #ChaikinMoneyFlow# #ALMAIndicator# #FinancialMarkets# #TrendAnalysis# #MarketReversals# #PriceAction# #RiskManagement# #InvestmentStrategy# #NASDAQ# #NYSE# #LSE# #JPX# #SSE# #HKEX# #Euronext# #TSX# #BSE# #NSE# #ASX# #DAX# #CAC40# #FTSE# #BIST100# #TradingTools# #GlobalMarkets#
Show more

2
Elevate Your Trading with EMA Hierarchy Score V 1.0
🔍 A cutting-edge indicator designed to analyze and rank Exponential Moving Averages (EMAs) for a structured and actionable approach to market trends.
✅ Key Features:
🧮 Hierarchical EMA Analysis: Uses a unique scoring system to assess the relative positioning of EMAs, providing insights into trend strength.
📊 Customizable Settings: Tailor EMA periods, smoothing parameters, and Bollinger Band configurations to fit your trading style.
🚦 Trend Labels: Real-time "UP" and "DOWN" signals for instant feedback on market direction.
🔄 Volatility Insights: Integrated Bollinger Bands highlight breakout and reversion zones for better decision-making.
------------------------------------------------------------
💡 Why use it?
The EMA Hierarchy Score transforms complex EMA structures into a clear scoring system, offering traders precise insights into trend alignment and market dynamics.
🌐 Try it now: EMA Hierarchy Score V 1.0
-------------------------------------------------------------
🔁 Your feedback matters: Test it out and share your thoughts to help refine this innovative tool! 🚀
------------------------------------------------------------
⚠️ Disclaimer: This tool is designed to enhance trading strategies but should not replace comprehensive market analysis. Practice responsible trading.
#Trading# #EMA# #TechnicalAnalysis# #TrendAnalysis# #FinancialMarkets# #MarketTrends# #StockMarket# #NASDAQ# #NYSE# #JPX# #LSE# #SSE# #HKEX# #Euronext# #TSX# #BSE# #NSE# #ASX# #DAX# #CAC40# #FTSE# #BIST100# #KOSPI# #TWSE# #BMV# #JSE# #MOEX# #SIX# #TADAWUL# #SET# #PSEI# #IDX# #Sensex# #Nifty50# #EuroStoxx50# #IBEX35# #SMI# #OSE# #Bovespa# #Russell2000# #ShanghaiComposite# #HangSeng# #GlobalMarkets#
Show more

1
📈 Introducing the Volume and Price EMA Hierarchy Scoring Indicator V 1.1
🔍 Simplify your trading decisions with the ALLin1 Indicator, a powerful tool designed to enhance your understanding of market trends by integrating multiple metrics derived from price and volume.
-------------------------------------------------------------
✅ Key Features:
📊 ALMA Calculations: Enhanced trend detection with Adaptive Linear Moving Averages.
🧮 EMA Hierarchy Scoring: Analyze relationships across exponential moving averages with precision.
🔄 Volume Integration: Leverages volume to amplify trend signals and reversals.
🎛️ Customizable Settings: Tailor inputs for ALMA, Aroon, ADX, and other modules to match your strategy.
--------------------------------------------------------------
💡 Why use it?
This indicator consolidates complex calculations into a single, streamlined tool, ensuring clarity and actionable insights. It’s perfect for traders looking to optimize their trend and volume analysis.
🌐 Explore it here:
Volume and Price EMA Hierarchy Scoring Relations V 1.1
🔁 Feedback is vital: Test the indicator and share your experiences to help us improve! 🚀
-----------------------------------------------------
⚠️ Disclaimer: This indicator is intended as a guidance tool and should not be relied on as the sole basis for trading decisions. Always use in conjunction with a comprehensive trading strategy.
#Trading# #TechnicalAnalysis# #PriceAction# #EMA# #ADX# #Aroon# #MarketTrends# #RiskManagement# #FinancialMarkets# #ChartAnalysis# #VolumeAnalysis# #NYSE# #NASDAQ# #JPX# #LSE# #SSE# #HKEX# #Euronext# #TSX# #BSE# #NSE# #ASX# #DAX# #CAC40# #FTSE# #BIST100# #KOSPI# #TWSE# #BMV# #JSE# #MOEX# #SIX# #TADAWUL# #SET# #PSEI# #IDX# #BSE500# #CSI300# #MSCIWorld# #Sensex# #Nifty50# #EuroStoxx50# #IBEX35# #SMI# #OSE# #Bovespa# #Russell2000# #ShanghaiComposite# #HangSeng#
Show more

1
🚨 TSLA Short Position Entry with Ichimoku & ATAMOKU - January 2,2025 (No.1)
🔎 Today, I analyzed Tesla, Inc. (TSLA) using monthly, weekly, daily, and 1-hour charts with the Ichimoku Cloud and ATAMOKU indicator. Based on this analysis, I am entering a short position to test the effectiveness of these indicators in decision-making.
Analysis Overview:
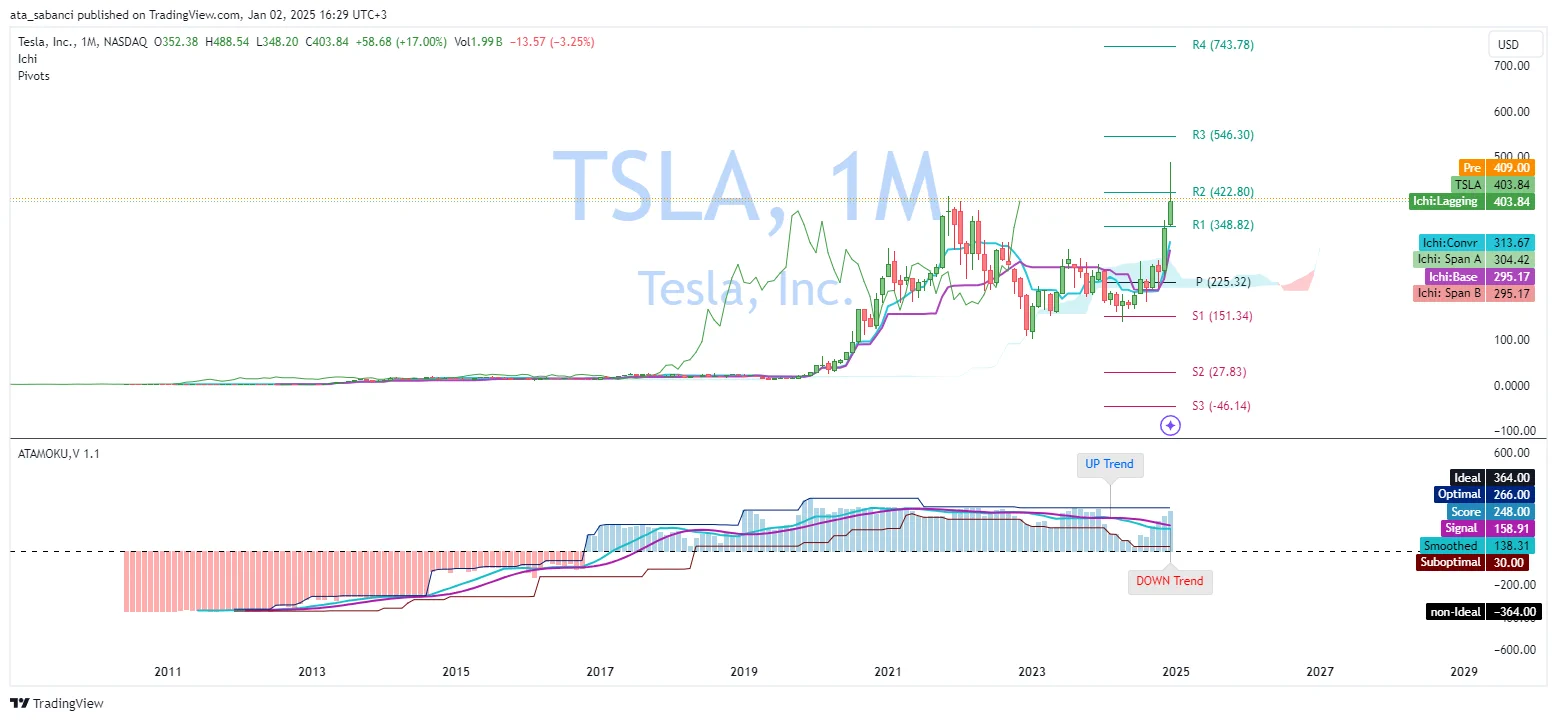
🟢 Monthly Chart:
TSLA is trading above the Ichimoku Cloud, confirming a long-term bullish trend. The ATAMOKU score is positive (248), and resistance lies at R2 ($422.80).
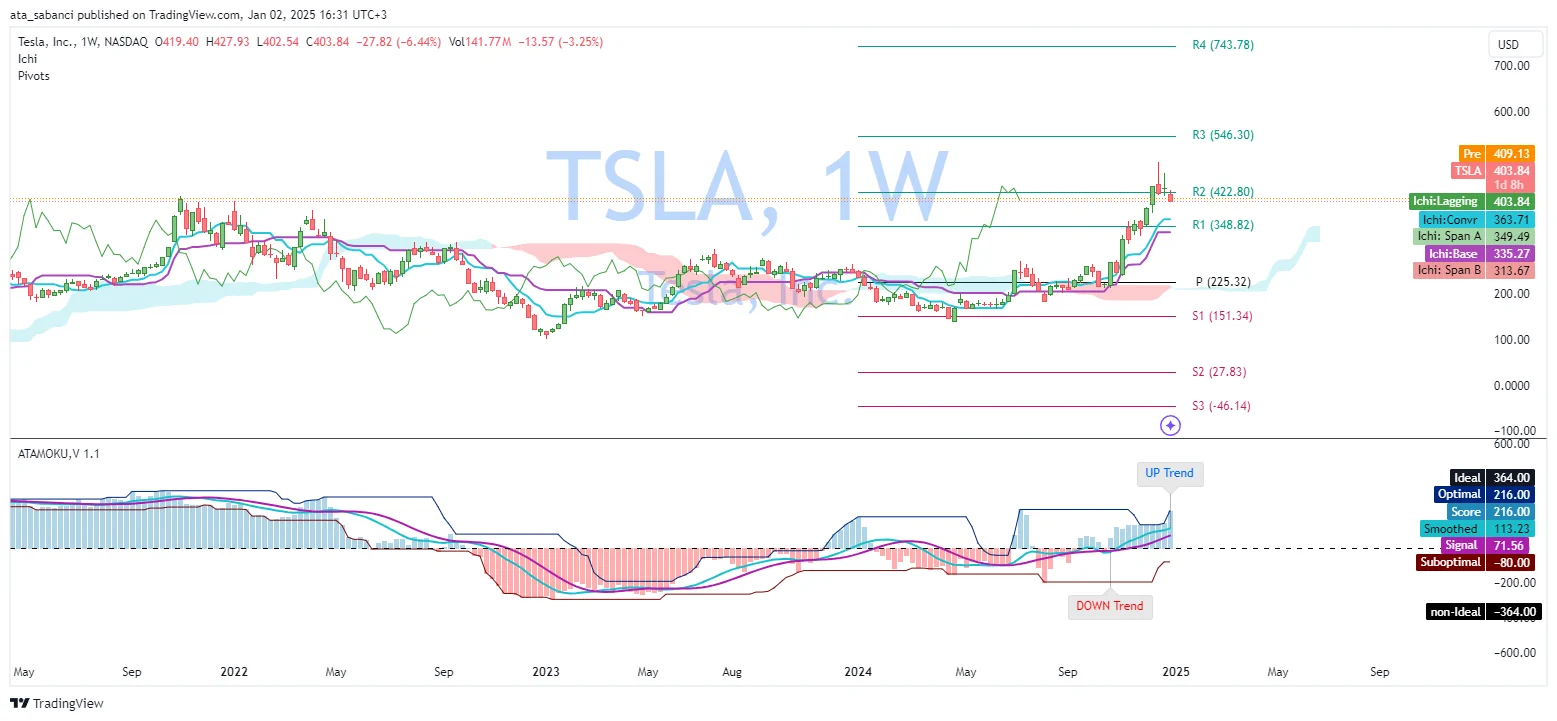
🟡 Weekly Chart:
The broader trend remains bullish, but TSLA shows signs of consolidation below R2 ($422.80). Key support is at the Base Line (Kijun-sen, $335.27).
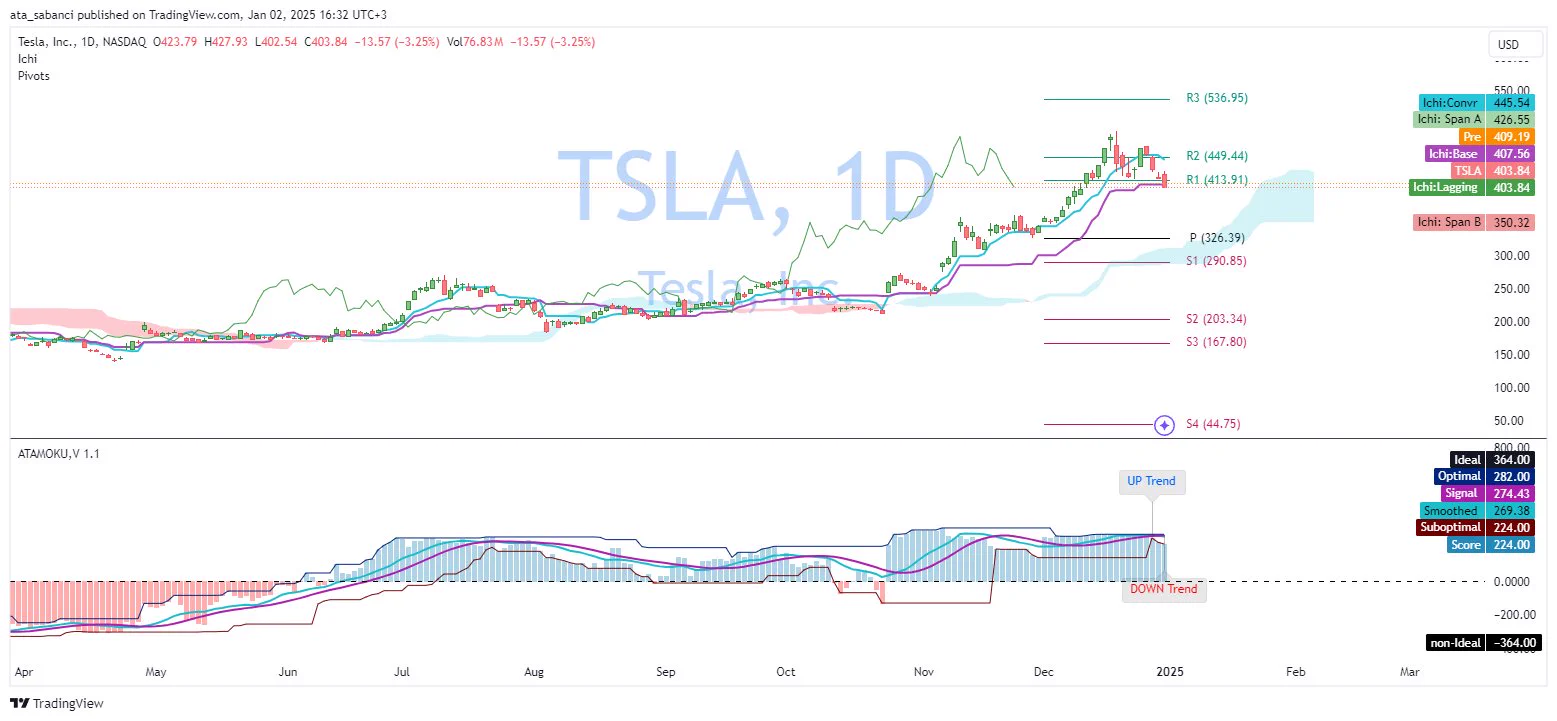
🔴 Daily Chart:
The price is nearing the Conversion Line ($445.54) but remains supported by the Ichimoku Cloud, suggesting caution in the medium term.
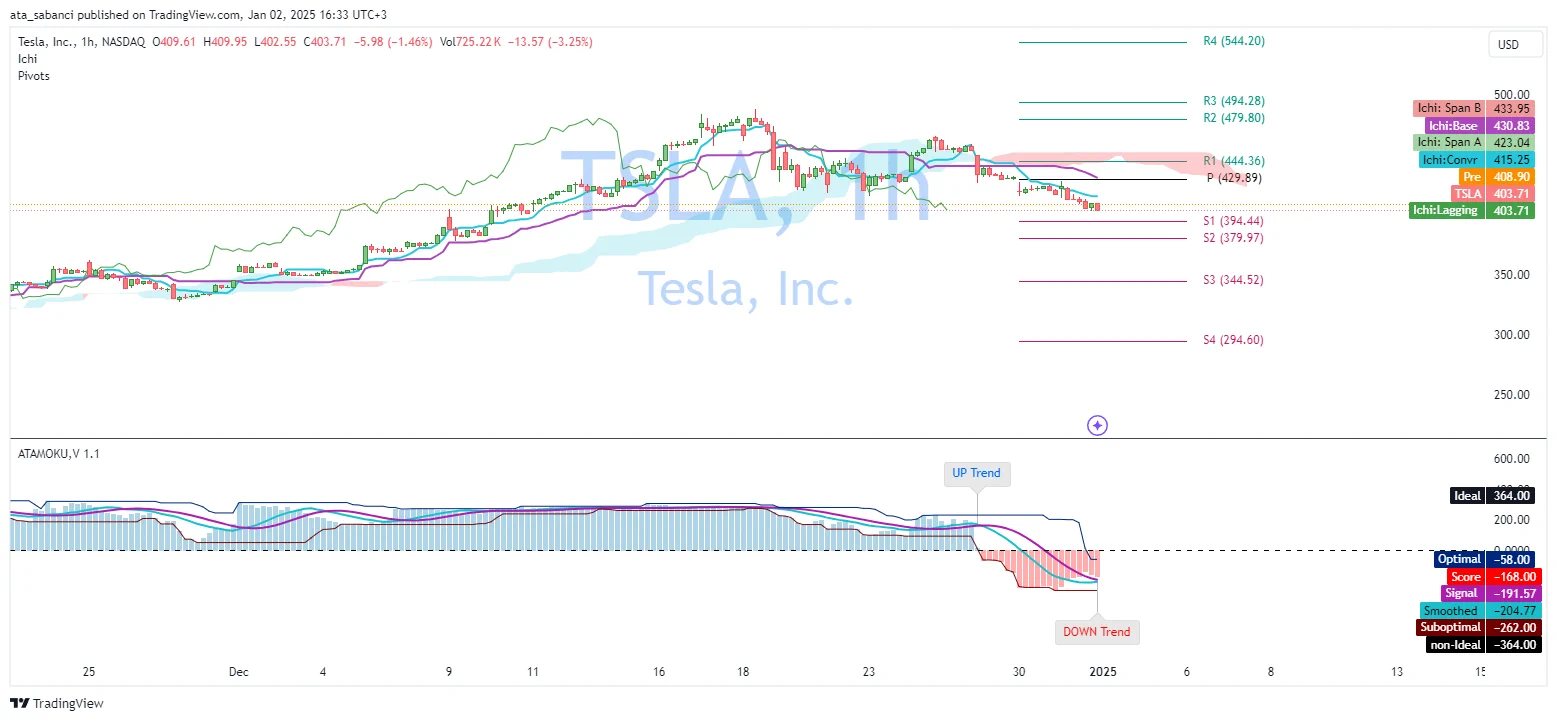
⚠️ 1-Hour Chart:
Short-term bearish momentum dominates, with TSLA trading below the cloud. R1 ($444.36) acts as a key resistance level, while support lies at S1 ($394.44).
Trade Execution:
📌 Action: Opened a short position of 5 shares at $444.36, targeting the short-term resistance on the 1-hour chart.
This position aligns with the short-term bearish trend while respecting the broader market context.
-------------------------------------------------------------
💡 Disclaimer:
This is an educational post. I’m using paper trading to demonstrate how traders apply indicators like Ichimoku and ATAMOKU in their decision-making process.
For a deeper understanding of my journey, approach, and methodology, check out my earlier post as following:
Always conduct your own research and analysis before trading. 📚
#StockMarket# #TSLA# #TeslaStock# #StockAnalysis# #IchimokuCloud# #ATAMOKU# #ShortPosition# #TechnicalAnalysis# #PriceAction# #TradingStrategy# #ChartAnalysis# #VolumeAndPrice# #StockTrader# #MarketTrends# #RiskManagement# #BearishMomentum# #TradingEducation# #NASDAQ# #InvestmentStrategy# #TrendAnalysis# #TransparencyInTrading# #PivotPoints# #FinancialMarkets# #DynamicSupport# #ResistanceLevel# #MarketBehavior# #LiveTrading# #StockCharts# #TechnicalIndicators# #TradingViewIdeas# #StockMarketEducation#
Show more
0

美股空头正遭受重创!在美国贸易法庭裁定,特朗普总统的全球关税非法后,股指期货飙升,美元走强。标准普尔500指数和纳斯达克100指数期货,分别上涨1.5%和1.7%。与此同时,英伟达(NVDA)发布强劲的营收预期后,盘后交易中股价飙升逾5%。牛市回归,科技股领涨。如果美股再创新高,我们会大幅至盈,因为小编在创业路上。
U.S. short sellers are getting crushed. Stock futures surged and the dollar strengthened after a U.S. trade court struck down President Trump’s global tariffs as illegal. S&P 500 and Nasdaq 100 futures jumped 1.5% and 1.7%, respectively. Meanwhile, Nvidia $NVDA soared over 5% in after-hours trading following a strong revenue forecast. The bulls are back—tech is leading the charge.
Show more
0

สร้างผลตอบแทนไปกับเมกะเทรนด์แห่งอนาคตผ่านกองทุน B-FUTURE จาก BBLAM
B-FUTURE คืออะไร
ในยุคที่โลกเปลี่ยนแปลงอย่างรวดเร็วด้วยเทคโนโลยีและนวัตกรรมใหม่ ๆ คนวัยทำงานจึงควรมองหาทางเลือกการลงทุนที่มั่นคงและมีศักยภาพเติบโตระยะยาว กองทุน “B-FUTURE” จาก BBLAM เปิดโอกาสให้พอร์ตการลงทุนของคุณเติบโตไปกับธุรกิจแห่งอนาคต อาทิ ปัญญาประดิษฐ์ (AI) แบรนด์เทคโนโลยีล้ำสมัย พลังงานสะอาด การแพทย์ดิจิทัล (Digital Healthcare) สิ่งแวดล้อม กลุ่มการเงิน กลุ่มวัสดุ เหมาะกับการลงทุนระยะกลางถึงยาว และยังช่วยเพิ่มโอกาสรับผลตอบแทนในอนาคตอีกด้วย
จุดเด่นและโอกาส
- เกาะติดเมกะเทรนด์ที่ขับเคลื่อนเศรษฐกิจโลกในระยะยาว โดยกองทุนจะเลือกลงทุนไปกับธีมที่คัดมาแล้วว่ามีโอกาสเติบโต เช่น เทคโนโลยีดิจิทัล สุขภาพพรีเมียม สังคมสูงวัย ความยั่งยืน พลังงานสีเขียว และการขยายตัวของสังคมเมือง (Urbanization)
- ปรับธีมลงทุนตามโอกาสตลาด โดยกองทุนต่างประเทศที่ B-FUTURE ลงทุนอย่างกองทุน Allianz Global Artificial Intelligence มีการปรับสลับน้ำหนักการลงทุนตามเมกะเทรนด์ที่เด่นในช่วงนั้น ช่วยให้พอร์ตการลงทุนไม่ตกขบวนเทรนด์การลงทุนใหม่ๆ ตัวอย่างเช่น เพิ่มการลงทุนในบริษัทผู้ให้บริการ cloud networking solutions ลดการลงทุนในบริษัทระบบอัตโนมัติอุตสาหกรรมออกไป เนื่องจากบริษัทมีการฟื้นตัวช้า ขายบริษัทผู้ให้บริการการชำระเงินดิจิทัลออกไป เนื่องจากราคาหุ้นปรับตัวสูงขึ้นจนใกล้เคียงกับราคาเป้าหมายระยะสั้นที่คาดการณ์ไว้ เป็นต้น (ข้อมูลจาก BF Product Update Q1/2025)
- กระจายการลงทุนทั่วโลก ไม่ผูกกับหุ้นประเทศเดียว เพื่อลดความผันผวนในแต่ละประเทศ และผลักดันพอร์ตให้ได้ประโยชน์จากการเติบโตทั้งสหรัฐฯ ยุโรป และตลาดใหม่ๆ
ลงทุนในอะไร (ข้อมูล ณ 30 เม.ย. 2568)
กองทุน B-FUTURE ลงทุนดังนี้
- กองทุน Alianz Global Arficial Intelligence 50.55%
- First Trust Nasdag Cybersecurity UCITS ETF 14.25%
- Invesco China Technology ETF 6.42%
- หุ้นต่างประเทศ 18.43%
ขณะที่กองทุน B-FUTURERMF ลงทุนใน
- Alianz Global Artificial Intelligence 50.54%
- First Trust Nasdaq Cybersecurity UCITS ETF 15.18%
- Invesco China Technology ETF 5.29%
- หุ้นต่างประเทศ 17.81%
ลงทุน B-FUTURE หรือกองทุนลดหย่อนภาษี B-FUTURERMF ได้ง่าย ๆ ผ่าน โมบายแบงก์กิ้งธนาคารกรุงเทพ หรือ BF Fund Trading จาก BBLAM หรือตัวแทนขายที่ได้รับการแต่งตั้ง
กองทุนประเภท RMF, Thai ESG และ Thai ESGX ของ BBLAM ใช้บัตรเครดิตธนาคารกรุงเทพลงทุนได้ผ่านช่องทางของธนาคาร
คำเตือน: การลงทุนมิใช่การฝากเงินและมีความเสี่ยงที่ผู้ลงทุนอาจไม่ได้รับเงินลงทุนคืนเต็มจำนวนเมื่อไถ่ถอน (ไม่คุ้มครองเงินต้น) / ผู้ลงทุนต้องศึกษาและทำความเข้าใจลักษณะสินค้า ข้อมูลสำคัญ นโยบายการลงทุน เงื่อนไขผลตอบแทน ความเสี่ยง และสิทธิประโยชน์ทางภาษีที่ระบุในคู่มือการลงทุนในกองทุน RMF ก่อนการตัดสินใจลงทุน / กองทุนที่มีการลงทุนในต่างประเทศมิได้มีนโยบายป้องกันความเสี่ยงจากอัตราแลกเปลี่ยนทั้งหมดหรือเกือบทั้งหมด ทั้งนี้ อยู่ในดุลยพินิจของผู้จัดการกองทุน ดังนั้นผู้ลงทุนอาจขาดทุนหรือได้กำไรจากอัตราแลกเปลี่ยนจากการลงทุนในกองทุนดังกล่าว หรืออาจได้รับเงินคืนต่ำกว่าเงินลงทุนเริ่มแรกได้
#BBLAM# #กองทุนบัวหลวง# #BFFundTrading# #MobileBanking# #ธนาคารกรุงเทพ# #RMF# #SSF# #ThaiESG# #thaiesgx# #หุ้น# #ai# #bfuture# #bfuturermf#
Show more

0